

How To Draw A Dag
Creating Minimal DAGs, Step-By-Step
Four suggestions to get started on the first version of your DAG
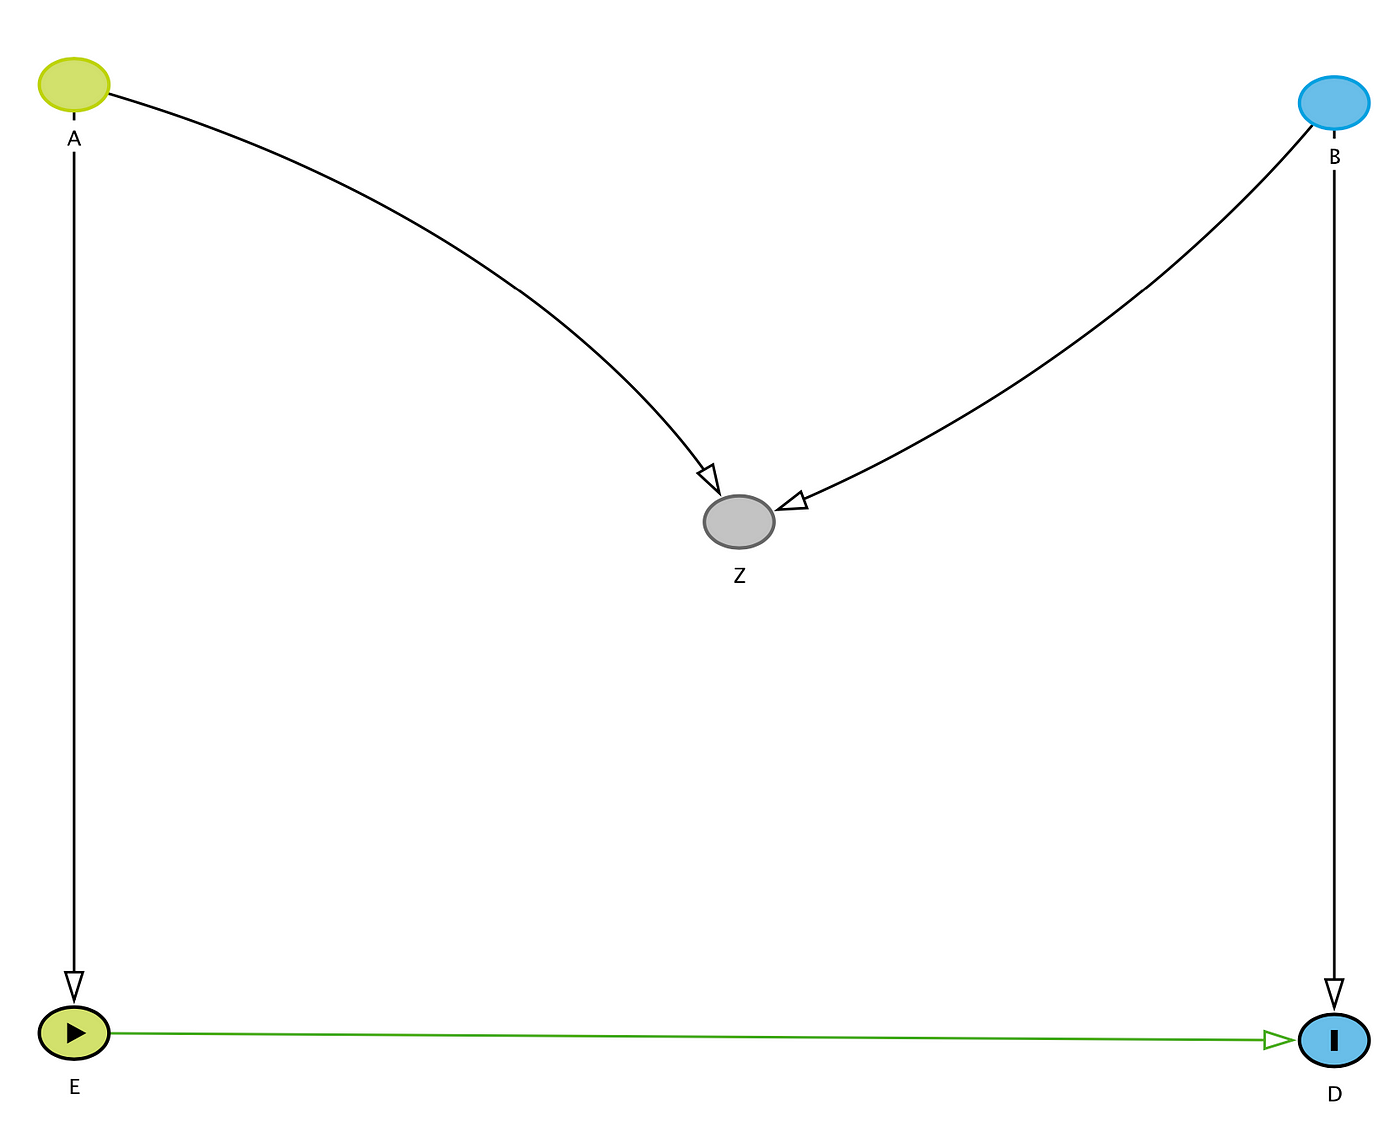
![]()
Disclaimer — This post assumes you are familiar with the language of causal inference, and have no fundamental ontological objections to using DAGs to describe causal models and causal relationships.
If you work in empirical/quantitative fields, chances are that you find yourself struggling with writing down causal inference problems on a daily basis. And if you also employ Directed Acyclic Graphs (in short, DAGs) in your causal adventures (for clarity, identification, debiasing, or any other reason), then you can probably recognize that DAGs may suffer from a bit of a "cold start" problem.
In fact , it can be difficult to draw a minimal DAG right away, simply starting from a causal question or a list of variables— or, at least, I have always struggled with this causal-inference-version of a writer's block.
While teaching-assisting a Causal Inference class, I shared some tips and tricks with students who were also having troubles with plotting and connecting a large number of given variables, all relating to the same causal question. Then, I thought I could actually share these with a wider, possibly interested (and equally struggling) audience.
So, here are some practical suggestions that can help you getting started with your minimal DAG, and getting one step closer to the identification and estimation of your causal effect of interest.
Defining the Causal Quantities
Defining the causal question will already give a sense of the quantities involved in the causal effect. Starting from the causal question, in order to get started with a minimal DAG, you will need to define at least three key variables:
- An agent, unit, or individual which experiences a certain state change.
If the unit is on an aggregate scale (e.g. average sales, average price change), it may help to re-define the unit on an individual scale (e.g. instead of average sales, sales level for one single customer), at least when writing the first version of the DAG. - An outcome variable.
- A state, intervention, or treatment variable, which, when changed, is believed to be inducing a change in the outcome for the unit.
Pearl (2009) also recommends to think about other quantities when you begin to define our causal models. These quantities are called causal parents (PA), and are all the relevant and immediate (observable) causes of the outcome variable. A causal parent PA must be included in the list of variables, if it also affects other variables modeled in the system. If you exclude such variables, there will be unobserved disturbances which influence several variables simultaneously, and this will cause many subsequent assumptions to be violated.
Writing a Minimal DAG
Once you have the list of (1) who/what is the unit of analysis, (2) the outcome, (3) the treatment, (4) the immediate causal parents of the outcome, you can start drawing the DAG in a few steps:
- Write down the outcome variable
- Write down the treatment variable and link it to the outcome variable
- Write down the causal parents of the outcome: the immediate and relevant causes of the outcome. Link them to the outcome using arrows.
- Make sure that the causal parents of the outcome that affect more than one variable (i.e. more than just the outcome) in the system are explicitly defined, and their links with the other variables are explicitly defined.
- (From Pearl, 2009) Think about and list the causal parents of the causal parents of the outcome variable (i.e. causal granparents).
If you think they are not directly relevant for your causal question, we can keep them in a separate, more extensive list, or in a separate, more extensive DAG for future reference.
Checking for Hidden Assumptions
These steps will give you the first, minimal DAG representing the relevant causal question. Afterwards, you may want to check a couple more things:
- The missing arrows: missing arrows in the DAG represent your assumptions. You are implicitly assuming independence among variables that are not connected by arrows. Are these assumptions plausible? Reasonable? Are they justified by previous research or existing theories?
- The unobservable disturbances or errors: so far, the DAG only contains observable quantities. Each quantity has also an unobserved component. For example, variable X has an unobserved component Ux, represented as: Ux → X
How are each variable's unobserved components connected to the variables in the DAG? Is any variable's U connected to any other observable variable? For example, if my DAG contains X, Y, and Z, it can happen that according to my intuition, experience, or reference theories, Ux may affect both X and Z:
X < — Ux → Z
Checking for Immediate Sources of Bias
Finally, you can initially reason about the treatment assignment mechanisms (although they would deserve an entirely separate article), by checking these quantities in the DAG:
- Is there any observed variable directly causing my treatment variable?
- Is there any unobserved variable affecting both my treatment and the outcome? E.g. if my treatment is T, the outcome is Y, I may have a situation like:
Y < — Ut → T
Intuitively, this is a violation of the ignorability assumption - Is there any unobserved variable affecting both the causes of my treatment and the outcome? E.g. if my treatment is T, the outcome is Y, the cause of my treatment is Z, I may have a situation like:
Y < — Uz → Z
Likewise, this is a violation of the excludability assumption
You can iterate these steps over different versions and updates of the DAG. Eventually, when you're happy with the minimal version, you can move on to more sophisticated graphical diagnostic tools for your model, like the d-separation criterion or the backdoor criterion. But I'll leave those fun things for the next causally oriented post.
Happy minimal-DAG drawing!
References
The only reference used in this post is:
Pearl, J. (2009). Causality. Cambridge university press.
But other very useful references are:
Heckman, J. J. (2008). Econometric causality. International statistical review, 76(1), 1–27.
Imbens, G. W., & Rubin, D. B. (2015). Causal inference in statistics, social, and biomedical sciences. Cambridge University Press.
Pearl, J. (2009). Causal inference in statistics: An overview. Statistics surveys, 3, 96–146.
Pearl, J., Glymour, M., & Jewell, N. P. (2016). Causal inference in statistics: A primer. John Wiley & Sons.
Pearl, J., & Mackenzie, D. (2018). The book of why: the new science of cause and effect. Basic Books.
How To Draw A Dag
Source: https://towardsdatascience.com/creating-minimal-dags-step-by-step-d604cb05e59a
Posted by: cochranhaustrand.blogspot.com
0 Response to "How To Draw A Dag"
Post a Comment